UPDATE: There’s a newer article where I explain all of this in much more detail:
Animated Gosper Curves in JS
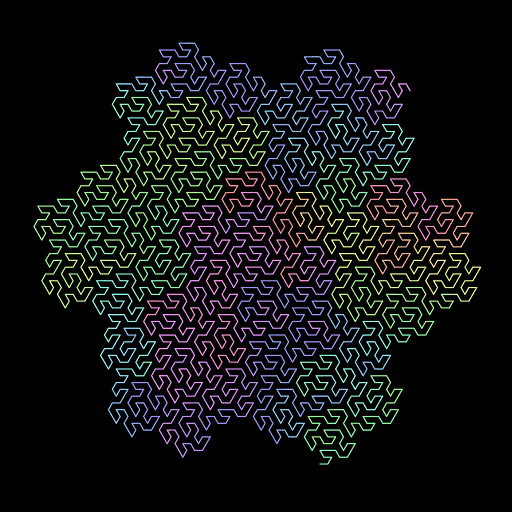
Yesterday I finished a script to generate colored Gosper Curves. You can find it in Github, as a Gist: gosper_curve.py.
The main idea behind this code is to generate an ordered list of points using a L-system (a set of production rules combined with a mechanism for translating the generated strings into geometric structures).
One extra idea I’ve applied is to work with the HSL color space instead of the RGB color space, this way I can do a random walk over the Hue dimension (with “smooth” steps) keeping lightness and saturation as constants.
And this is one of the generated images:

